How this works
This page explains where the numbers come from and what they cannot tell you. The full write-up with every assumption is in the repository: docs/ASSUMPTIONS.md. How well the estimates held up is on the accuracy page.
Data
Two sources, and every page says which one it is showing.
This project's own snapshots (Spring 2027). A scraper on GitHub Actions reads the public section pages of classes.berkeley.edu, which carry the enrolled count, capacity, waitlist count and waitlist capacity of every section, and stores one Parquet file per run on the repository's data branch. High-demand sections (a priority list generated from the previous cycles' reconstructed waitlist joins) are read every 30 minutes; every other section is read about every six hours. Only pages the site's robots.txt allows are requested; the request rate is set in the scraper workflow and every change to it is dated in the project's data log. Collection for Spring 2027 starts when Phase 1 opens on Oct 26, 2026.
Berkeleytime's public history (Spring 2026). Until Spring 2027 waitlists start clearing, the estimates come from the Spring 2026 enrollment cycle as recorded by Berkeleytime, which polls the same counts and serves each section's history through its public API. Spring 2026 is the same season as Spring 2027 with the same shape of calendar: a three-week Phase 1 in late October, Phase 2 through the winter break, instruction in mid-January. Berkeleytime's record of it runs from the first day of Phase 1 (Oct 27, 2025) to mid-May with two dark days, so the adjustment period and the first weeks of instruction are observed. The Fall 2026 cycle, which the site showed until this change, has a two-week hole across exactly that stretch (Aug 19 to Sep 1, 2026), a two-month Phase 1 (mid-April to mid-June), and clearing that ran markedly slower: within 14 days of joining in Phase 1, 48% of hypothetical students at positions 1 to 5 got in against 66% in Spring 2026, and 24% against 39% at positions 6 to 15. Fall 2026 stays frozen for the accuracy test and the cross-cycle comparison. That history is the run-length form of Berkeleytime's poll (at a change, half the readings come within 16 minutes of the previous one and three quarters within 85; a gap wider than three hours is treated as a gap, never as stillness, and the share of section-time lost per day is published in the analysis output). Because those gaps cut most hypothetical students' follow-up short (the median window is 15 days), probabilities past about 30 days are read off a thin tail of the curve, which is why the pages print a floor once your days left exceed the curve's reach. These numbers are labelled from Berkeleytime's public history on every page that shows them and are not part of this project's own collection.
Neither source observes student identities or positions: the data are aggregate counts.
From counts to flows
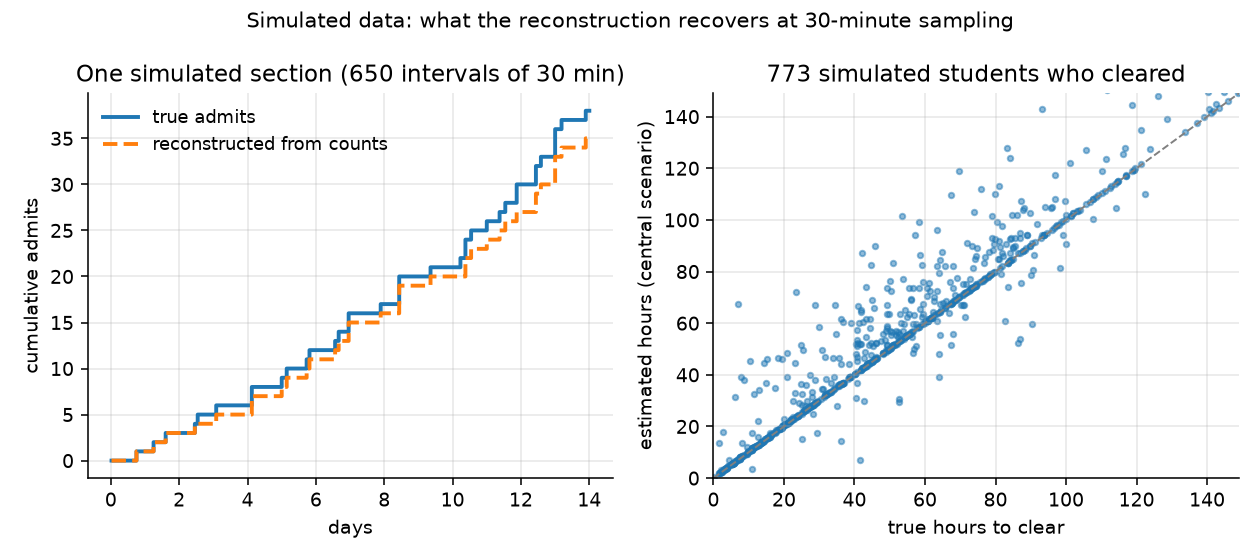
Between two readings of a section, the change in the enrolled and waitlisted counts is split into admits from the waitlist, joins, drops from the waitlist, direct enrolments and drops from enrolment, under the rule that a seat cannot go to a newcomer while someone is queued. Events that cancel within one interval are invisible, so every flow is a lower bound. On simulated waitlists sampled every 30 minutes the reconstruction recovers about 91% of admits and 96% of joins, and every interval containing a single event exactly.
From flows to odds
For each section and each sampled moment at which a waitlist could be joined (a queue exists, or the section is full), hypothetical students are placed at positions 1 to 100 of the queue as it stood then. Each moves up by one place per admit ahead of them; a waitlist drop moves them up with the probability that the dropped student was ahead (the "central" scenario; the analysis also computes the best and worst cases, in which every drop was ahead or behind). The time until the hypothetical student reaches the front is the outcome; if the data ends, the section vanishes, or a collection gap intervenes first, the outcome is censored, which survival analysis handles correctly.
"Got in" and "cleared" mean the same thing here: the hypothetical student reached the front of the queue and a seat went to that position. The pages say got in; the analysis code and reports say cleared. Neither means the student's enrollment went through: a time conflict, a unit cap or a full discussion section can still block it.
The headline number is the Kaplan-Meier estimate of having got in within the time you have left: the page counts the days from today to the last automatic waitlist run of the term and reads the curve for your course and position there, with a 95% interval from resampling sections. The by-when table reads the same curve at 7 and 14 days and at the first day of instruction. The curve is the course's own for that position bucket when the course has at least 30 cases; otherwise the department's, otherwise all courses', and the page labels the fallback as pooled. That rule comes from the backtests: within Fall 2026, curves fitted per course predicted later joiners no better than the position bucket alone, because clearing sped up for everyone once Phase 2 opened; across whole cycles (fit on Spring 2026, scored on Fall 2026) course identity transferred, and the course curve beat the position bucket at 14 days, 28 days and the last automatic run (the accuracy page has the scores). when your horizon is longer than the data followed anyone, the page says so and shows the value it can support as a floor. The verdict words (Likely, Could go either way, Unlikely, Too little data to call) are fixed cut-offs printed next to every verdict, not a model. A Cox proportional-hazards model relates the clearing rate to position, list length relative to capacity, course level, department, enrollment phase and days remaining before instruction; its assumptions are checked and reported in the analysis output, and it is not used for any number on the pages.
How the estimates are tested
The model is frozen on one set of hypothetical joiners and scored on another it has not seen: joiners after a date against joiners before it (with the earlier joiners' outcomes cut off at that date, so nothing later leaks in), courses held out as a group, and, once two cycles exist, one term against the next. Every test row is scored at its own horizon with inverse-probability-of-censoring weights, so joiners whose outcome was still unknown at that horizon are neither dropped (which would keep the fast clearings and lose the slow ones) nor counted as failures. The reports compare four predictors: the position bucket alone, the course-and-bucket curve the pages use, the literal number the first version of the lookup showed, and the Cox model; they are in reports/backtest_<term>/ in the repository and summarised on the accuracy page, which also states what will be scored on Spring 2027 before that data exists.
What this cannot tell you
- Reserved seats break strict queue order: a section can hold seats for a category you are not in, and its waitlist can stand still while seats are open.
- Time conflicts, unit caps and full discussion or lab sections can stop an enrollment that the queue would otherwise have allowed; the counts do not see them.
- Departments process some waitlists by hand and the registrar runs the automatic process in batches, so time to clear includes processing delay.
- Estimates describe one past cycle. Policies, capacities and demand change between terms; the Spring 2026 numbers stand in for Spring 2027 until this project's own data exist.
- Small courses give noisy numbers; the sample size and the interval are printed with every estimate for that reason.
Reproducing the numbers
Everything is public: the scraper, the snapshots, the reconstruction, the models and these pages. make analysis TERM=2272 in the repository rebuilds every table, figure and the JSON behind the pages from the raw Parquet files; make backfill-analysis TERM=2262 does the same from the Spring 2026 history (TERM=2268 for Fall 2026), make backtest writes the test reports and make site-data rewrites the site's files from a saved cohort. The pages compute nothing: they read curves at a day and print what they find. The claims and the commands that verify them are in CLAIMS.md.